
Start Mining Today!
Managed Mining
Remote Hands
Mining Services
Case Studies
MiningStore
Contact Us
(877) 467-7780
Menu


To briefly recap on Part 1, we compared the mining profitability of two Antminer S19s. Using the Braiins Profitability Calculator, we pitted the Antminer S19 Pro against the Antminer S19 XP. In our calculations we accounted for a consistent increase in difficulty (+100%/year), an increase in BTC price (+50%/year), and the lead time between receiving either machine (would receive the S19 XP about 6 months later than a S19 Pro).
Results:
Now we want to focus on understanding how the values of mining rigs change over time with difficulty and BTC price fluctuations. Without factoring in the value of the ASICs on your balance sheet, it’s hard to fully grasp the validity of your bitcoin mining business model.
In order to do this, we’ll first take a much less conservative approach towards Bitcoin price and will assume it will continue to grow at its 196.7% compound annual growth rate. Generally, when BTC price is increasing, the value of ASICs will increase as well due to greater demand to mine.
As mentioned in Part 1, it’s important to keep in mind that mining in North American is rapidly scaling up. So where we’ll stay conservative is in our 100% yearly increase in difficulty. From here we’ll compare ASIC appreciation values to understand the influence our mining hardware can have in our internal rate of return.
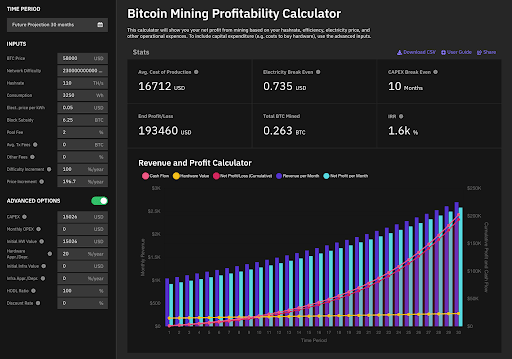
With an Antminer S19 Pro 110 TH, we break even after 10 months of mining, and mine a total 0.263BTC by the end of our 2.5 years. An important number to note is our 1.6k% IRR (internal return rate).
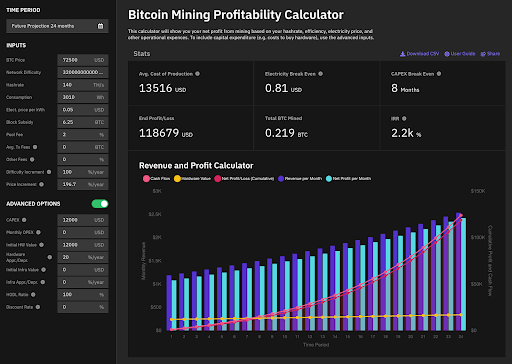
After two years with the Antminer S19 XP 140 TH, our P/L is roughly $75k behind the S19 Pro. We also mine 0.044 less BTC. We do, however, break even two months faster, and our IRR is also higher at 2.2K%.
Lastly, let’s suppose the opposite scenario takes place. How do our two Antminer mining rigs perform when price decreases at rate of 15%/year (to simulate decline into a bear market), the value of our ASICs is depreciating at 15%/year, and difficulty only increases 50%/year instead of our usual 100%?
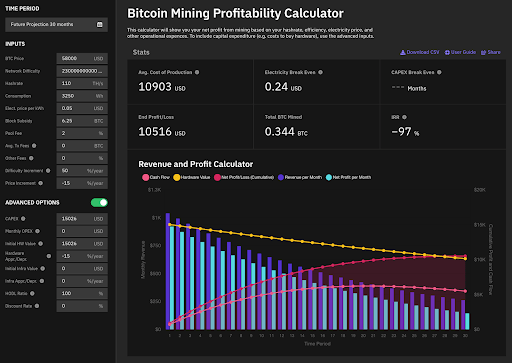
Despite the lower starting difficulty, an S19 Pro won’t help us break even in our incredibly bearish 2.5 year time frame. We’ll bring in 0.344 BTC, but our cost of production overwhelms our P/L.
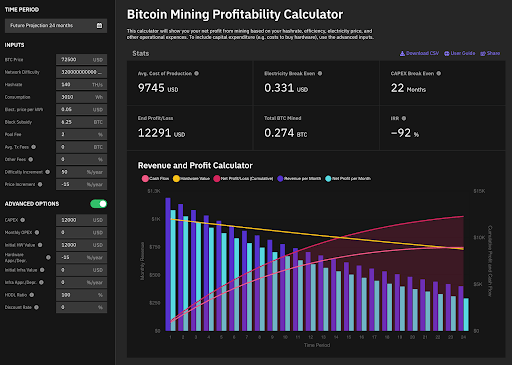
Because the S19 XP is much more efficient than the S19 Pro, we break even two months before our two year timeline is complete. Although we bring in less BTC, we can still be profitable by the end of the two years.
We’ve now covered three separate scenarios across our S19 Pro vs S19 XP profitability analysis. If price and ASIC value do not fluctuate, if both price and ASIC value increase, and finally if both decrease. Difficulty and BTC price fluctuations can greatly impact the value of mining rigs over time. Higher efficiency in the XP, and a lower pricetag helped us break even during our worst case scenario. But in our more bullish example, the S19 found us more profit and BTC.
Hopefully these simulations can help you decide which Bitcoin mining rig model is the most appropriate for your operations. For more information about mining operations, see our other articles here!